
introduction
To understand the different coding methods, we need to first examine our initial information. Specifically we are going to look at the entropy of our source.
Entropy in our context is the lack of order or predictability in some data. It is the amount of information that is contained in the data and it is also a measure for how much a message can be compressed.
The unit of entropy is bit. To calculate entropy H of a variable X with values xi with i=1,…,n:
With pi equal to the probability that X holds the value x.
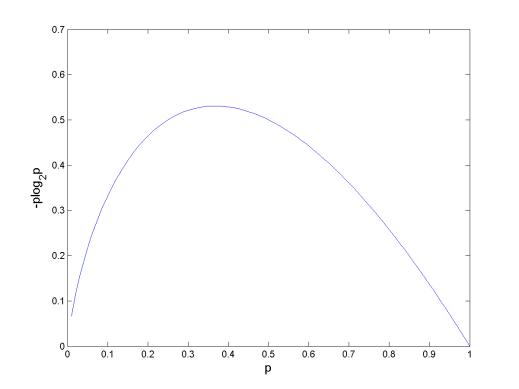
The minimum value for entropy is 0. Take note that an event that certainly will or will not occur does not contribute to entropy (because either pi is 0 or log(1) is 0). And as seen in the graph, events with a probability of approximately 0.4 contribute the most to the entropy.
A variable that is truly random (each possible values is equally likely to occur), has maximum entropy:
Note: if your calculator doesn’t allow you to do log2 or if you’re getting tested on this and aren’t allowed to use a calculator that can, remember to convert the bases of log using this formula:
examples
example 1
Calculate the entropy of a “fair” dice.
show answer
method 1
method 2
With method 2 you can clearly see why we can simplify the formula to for events that all have the same probability.
example 2
Calculate the entropy of a dice with the probability of 0.5 for the value 3 and an equally distributed probability for the other values.
show answer
and
The chance of the dice being anything but 3 is 1-p3 so 0.5, we divide the chance of that happening equally between the remaining numbers (there are 5 remaining numbers).